Although it’s not listed in the IntelliSense dropdown list, MS Graph supports an Export method that lets you save your charts to GIF format. Doug Den Hoed shows you the benefits of exporting your chart and presents an interesting twist—using Access to create an MS PowerPoint slideshow that animates your charts.
One of the best Windows options I ever accidentally set was Start, Control Panel, Sounds, Open Program. The .wav file I associated with that event plays whenever a program starts up—including programs running in the background. That sound was my first clue that the MS Graph charts in my Access applications were using a lot of overhead. Until then, I simply painted a separate chart on each form and report. It turns out that each one of those charts was starting a separate instance of the MS Graph utility (something that I confirmed by using the Task Manager).
Nowadays, no matter how many graphs I intend to display, I only put one chart in my applications—usually on a form that stays loaded to minimize the overhead of running MS Graph. I manipulate that chart’s properties at runtime to create what the user wants to view. Then, when it’s time to run a report of the chart, I quietly export the chart to a GIF file and display it on the report as an image. This might sound complex, but it can actually save time. For instance, if you a preview and then print a chart, you actually run the chart twice. With my method, the chart is only generated once. The method also saves precious resources, reducing the number of times that I run into the “Too Many Tables” error, as I have in some of my more complex applications.
Exporting a GIF is as simple as calling the object’s Export method, like this:
Me.objGraph.Export "c:\temp\graph.gif", "GIF", False
The Export method requires three parameters: FileName, FilterName, and Interactive. The FileName parameter gives the filename to which the image of the graph will be saved. The FilterName sets the file type for the resulting file (you can also use JPG and TIFF). In theory, setting the final parameter to True will invoke an editor to work with the picture, but it’s just as likely to generate an error.
The report (rptGraphToGIF) has an image control painted and linked to the path and file used in the export. You could create a Web page to pick up the GIF in the same way, or you could write some code to e-mail the GIF to a distribution list. I went another way.
The main form (frmGraph) is shown in Figure 1. The chart is intended to show the correlation between a stock’s movements and the cumulative Buy/Sell transactions. I’ll give you an overview of how the form works and explain some SQL techniques before I describe the chart itself.
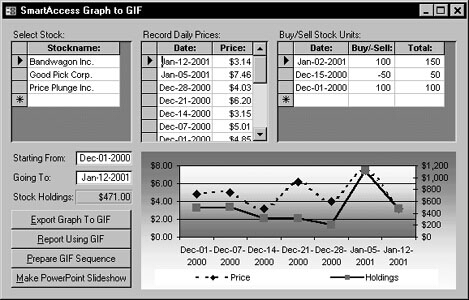
Figure 1
I’ll GIF an example
The top left datasheet shown in Figure 1 lets you enter the name of a stock that you wish to track. The middle datasheet lets you enter daily closing prices for the current stock. The right datasheet lets you record Buy/Sell Stock Unit transactions.
The right datasheet also shows a running sum column of the Total holdings using a trick you might not have seen. For each row in the datasheet, a DSum adds up all of the Unit transactions for the current StockID, up to and including the current row’s TransactionDate, to the nearest day (using a CLng conversion). Here’s the formula behind the Total column:
CDbl(nz(DSum("Units","tblPortfolio", "StockID="

& [StockID] & " AND CLng(TransactionDate)

<=" & CLng([TransactionDate])),0))
As you click around and edit the datasheets in the sample form, my code populates the Starting From text box with the earliest Price date and populates the Going To text box with either the current Price date or the current Transaction date. The form then computes the effective stock holdings “as of” that Going To date.
In my experience, calculating results from a date is a common business problem. In Access, I usually use a layered query to solve it. In this case, the first layer (qselLatestStockPriceDate) groups each StockID in tblPrice with the maximum PriceDate that’s less than or equal to the Going To date. The second layer (qselEffectiveStockPrice) then joins that query to the tblPrice itself to pull the price that matches each StockID/PriceDate combination. I could create the same thing in SQL with a self-joining correlated subquery (qpstEffectiveStockPrice) that looks like this:
SELECT a.StockID, a.Price

FROM tblPrice AS a

WHERE (((a.PriceDate)=(SELECT Max(b.PriceDate)

FROM tblPrice as b

WHERE a.StockID = b.StockID

AND b.PriceDate<=[Forms]![frmGraph]![txtDateTo]

)));
The chart itself shows two axes—stock price on the left, holdings on the right—for each PriceDate between the Starting From and Going To dates. The code behind cmdExport_Click is trivial:
Me.objGraph.Export "c:\temp\graph.gif", "GIF", False
Using graph
Something interesting happens to the chart when you use the arrow keys to move up the Price datasheet: The datasheet requeries as you go, showing how the price and transactions “move” over time. With data that’s more complex than this sample, this continuous display will help users spot trends they might otherwise miss. Since this is exactly the kind of data that ends up in presentations to management, I thought it would be useful to make Access create a PowerPoint presentation that simulates the same effect.
The cmdPrepareGIFSequence_Click event does the preparation. First, it kills all GIF files in the c:\temp directory. Then it iterates through a recordset of each Price Date between the Starting From and Going To dates. The code pokes each date into the Going To date on the form, requeries the chart (waiting two seconds for it to refresh), and then exports the chart to c:\temp, concatenating the current Stock name and Price Date to form a unique filename for the GIF. One of the more useful side effects of the code is that you get a preview of what the PowerPoint presentation will look like.
Once the GIF files are in place, you can click the cmdPowerPoint button, which calls a standard module that I wrote named pptCreateGIFShow. It uses Automation to create the PowerPoint slideshow and requires a proper reference to the PowerPoint library.
First, the routine uses the Dir command to confirm that there are GIF files (cstrFileType) in the temporary directory (cstrPath). If not, the routine exits:
strFilename = Dir(cstrPath & "*." & cstrFileType)

iastrFilename = 0

If Not Len(strFilename) > 0 Then

Exit Function

End If
If GIF files do exist, the strFilename will contain the first filename retrieved by the Dir function. Subsequent calls to the Dir function without any parameters will return the rest of the filenames, one at a time. Unfortunately, the filenames will be returned randomly. I load the filenames into an array that I can sort later. When the Dir command returns a zero-length string (which I check for by using the Len function), all of the filenames have been loaded into the array:
While Len(strFilename) > 0

ReDim Preserve astrFilename(iastrFilename + 1)

astrFilename(iastrFilename) = strFilename

strFilename = Dir

iastrFilename = iastrFilename + 1

Wend
I used some borrowed code to sort the array of filenames into ascending order. The code is the QuickSortArray from the Visual Basic Developer’s Handbook by Ken Getz and Mike Gilbert (Sybex). Rather than reproduce the code here, I’ll direct you to the book.
With the array sorted, I instantiate PowerPoint and add a new presentation. I’ll admit up front that I generated most of the PowerPoint code by turning on the Macro Recorder in PowerPoint and then walking through what I wanted to do. These settings put PowerPoint into Kiosk mode, which causes PowerPoint to run in full-screen mode and disables the ability of the user to interrupt the presentation:
Set objPPApplication = New PowerPoint.Application

Set objPPPresentation = _

objPPApplication.Presentations.Add

With objPPPresentation.SlideShowSettings

.ShowType = ppShowTypeKiosk

.LoopUntilStopped = True

.ShowWithNarration = True

.ShowWithAnimation = True

.RangeType = ppShowAll

.AdvanceMode = ppSlideShowUseSlideTimings

.PointerColor.SchemeColor = ppForeground

End With
Now the important part—creating a slide for each GIF file. First, I add a new slide to the Slides collection. Both the Title for the slide and the Chart become members of the current slide’s Shapes collection. As you can see, setting the Title’s Text property to the filename is tricky, involving setting the Text property of the TextRange of the title’s TextFrame.
Do Until iastrFilename <= 0

Set objPPSlide = objPPPresentation.Slides.Add _

(1, ppLayoutObjectAndText)

objPPSlide.Shapes.Title. _

TextFrame.TextRange.Text _

= astrFilename(iastrFilename)
To add the Graph, I chose to set the LinkToFile property to False. This causes the GIF file to be embedded in the PowerPoint presentation. The result is a larger PowerPoint file, but the slideshow is completely self-contained. I decided to advance the slides as quickly as possible (one second) and loop continuously. You might want to expose some of my constants as parameters to pass from a submission form so users can make their own choices.
Call objPPSlide.Shapes.AddPicture( _

FileName:=cstrPath & astrFilename(iastrFilename), _

LinkToFile:=False, _

SaveWithDocument:=True, _

Left:=60, _

Top:=150, _

Width:=600, _

Height:=300)


With objPPSlide.SlideShowTransition

.EntryEffect = ppEffectNone

.AdvanceOnClick = False

.AdvanceOnTime = True

.AdvanceTime = 1

.SoundEffect.Type = ppSoundNone

End With

iastrFilename = iastrFilename - 1

Now that the slides are complete, I save the presentation as PowerPoint file:

objPPPresentation.SaveAs cstrPath & _

strFilenamePrefix & _

CStr(Format(Now, "yyyy-mm-dd hh.nn.ss")) & _

".pps", ppSaveAsShow
I tried to run the slideshow right away, but there’s a “gotcha”: If you start to run PowerPoint, you won’t be able to release PowerPoint in the next step. If you don’t release the PowerPoint application, it locks the .pps file and stays “stuck” in the Task Manager. Instead, I just display a message:
MsgBox "The PowerPoint Slideshow '" & cstrPath _

& strFilenamePrefix & _

CStr(Format(Now, "yyyy-mm-dd hh.nn.ss")) & _

".pps" & "' is ready!", _

vbInformation + vbOKCancel, _

"PowerPoint Complete"
Finally, I close the PowerPoint session in the exit routine. The PowerPoint presentation is now ready to run:
Set objPPSlide = Nothing

Set objPPPresentation = Nothing

objPPApplication.Quit

Set objPPApplication = Nothing

Exit Function
Whether you want to extend your application’s functionality by exporting charts for Web pages, e-mails, or PowerPoint, or if you’re just looking for a way to speed up your charts, the examples in this article will help.