In this article, Garry Robinson shows you how to use a class to manipulate Microsoft Excel. His class provides a software layer that hides the complexity of dealing with Excel through VBA. You’ll see how to use Garry’s class to push single pieces of data into Excel, how to transfer data from queries into Excel, and how to let users navigate between results using bookmarks.
After 25 years of developing computer software, there’s one product line that I’ve always avoided like the plague and that is the spreadsheet. I’ve never considered the spreadsheet a programmer’s tool–it’s something to be used strictly by end users. In fact, the majority of the work that I’ve been involved in for the past 10 years has been converting spreadsheets into database applications. However, while my clients appreciated the benefits of a true database application, they didn’t want to give up their Excel reporting and analysis functionality. So I found myself building Access applications that used Excel to handle reporting.
Some time ago, when yet another Excel automation job came around and I found myself copying lots of VBA code to make each Excel report work, I decided that there had to be a better way. After reading quite a few articles by people far brighter than me about the usefulness of class modules in Access 97, I set about writing an Excel class. Seven years later my team and I are still using the same Excel class.
Setting up your Excel template
If you’re going to use Excel, you need to use Excel templates. Excel templates provide a reusable structure that you can export your Access data into. You start with an Excel spreadsheet, making it look as close to the final requirement as you can. This particularly applies to deciding on the location of the information in the spreadsheet. Formatting isn’t as important in the initial stages, as you can apply formatting at the end without much effort.
Once you’ve decided on the layout of your spreadsheet, you convert it to a template file by changing the file type from *.XLS to *.XLT. Making a spreadsheet into a template protects it from being easily changed, resolves sharing issues, and supports using multiple query filters (I’ll discuss this later in the article).
Using Excel for reporting is a different process from reporting using more conventional tools such as Access or Crystal Reports. While database reporting design is primarily about setting up a sample row of information that will be displayed, irrespective of the total numbers of rows, Excel is primarily about filling in cells in a spreadsheet and is very much affected by how many rows you’ll have. Before you embark on using Excel, start up the Help in Excel and search for the string “Sharing External Data.” The topics that appear will give you a good idea of the different ways that you can get external information into a spreadsheet.
When using Excel for reporting, your report template should have the following features (Figure 1 shows a sample template):
- Designated cells in the body of the report where you’re going to insert the rows from your query. In Figure 1, the information that comes from the database appears in rows 7-10.
- Areas for calculated totals. The totals in the sample report appear on row 14.
- Space rows to organize the data. In Figure 1, rows 11-13 separate the totals and query information.
- Headers and other text information, surrounding the data, that usually remain static. These should be placed in the template rather than inserted from Access.
- Feedback on the data that appears in the report. It’s very likely that you’ll want to display the information that the users used as the criteria for the selecting data. In the sample, the date range and product type are examples of feedback information.
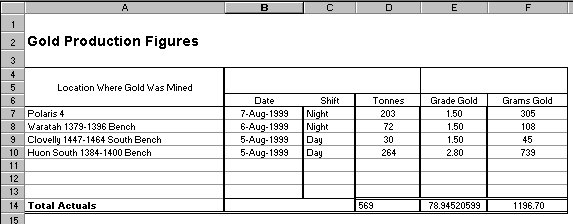
Figure 1
When you design your template, you should always allow more rows than you’ll ever need to accommodate the rows of data that will come from your database. It’s not obvious in Figure 1 that I allowed room for extra rows, but that’s because after I added the data in rows 7-10, I deleted all the remaining unused rows. Because Excel is smarter than your average bear, the formulas that I have at the bottom of the spreadsheet adjusted themselves to cope with the missing rows. In the template, I had 200 blank rows ready to take information but, in this example, I only need the four rows 7-10.
You don’t have to follow this strategy. Another solution is to place all cells with the formulas that calculate totals across the top of the spreadsheet (above your data rows); then you probably won’t have to delete anything.
Starting Excel
With your template built you’re ready to start using my class module. Before using the class, you’ll need to copy the module into your project before writing your code. In that code, you need to declare a variable to work with the class, use the New keyword to load the class, and then call the class’s OpenExcel method, passing the path to your Excel template:
Dim Excel_FX As FXc_Excel

Set Excel_FX = New FXc_Excel

Excel_FX.OpenExcel "c:\excelRep\myReport.xlt"
At this point, I’m going to switch focus from the Access code that uses my class module to the code in the class. The code in the OpenExcel method starts Excel by using VBA’s GetObject function. Once Excel is open, I add the template to Excel’s Workbooks collection to create a new spreadsheet based on the template. And, because Excel works better in full screen mode, I set the FullScreen property of Excel to true:
Sub OpenExcel(TemplateFile As String)

  Set xls = GetObject(, "Excel.Application")

  xls.Workbooks.Add TemplateFile

  Excel_FX.FullScreen = True
Back to Access: Now that Excel is open, you can add information to any cell in the spreadsheet using my CellValue method. This method must be passed the data to be inserted, the cell to put the data in, and the name of the Worksheet that the cell is in. This sample puts the current date in cell B4 on the “Production” worksheet:
Excel_FX.CellValue Date(), "b4", "Production"
Using CellValue makes sense for the feedback data where you’re inserting data into a single cell. However, attempting to add all the data from a query into the spreadsheet using CellValue would be awkward. Fortunately, I have another method.
Updating and deleting rows
To display the fields in each row of the recordset, you should use my CellValueRC method. This method accepts a field, a row number, and a cell number. This method is far easier to use when adding rows of information than using letter-number cell references because you can build loops to generate the row and column numbers. This code opens a saved ADODB recordset and then loops through the first five fields inserting their data into the cells in a single row. After processing one record, the code moves onto the next row, incrementing the row position:
Dim repRowInt As Integer

Dim rst As ADODB.RecordSet

Const BegRepRow = 7

Const BegRepCol = 1

Set rst = New ADODB.Recordset

rst.Open "c:\excelRep\production.rst"

Do Until rst.EOF

  For fld = 0 To 5

    Excel_FX.CellValueRC rst(fld), _

      BegRepRow + repRowInt, fld + 1

  Next

  repRowInt = repRowInt + 1

  rst.MoveNext

Loop

rst.Close
It’s time to go back to my class code. Both the CellValue and CellValueRC methods begin by calling the SetWorkSheet method, which sets a module variable (xlsSheet) to point to a particular spreadsheet. If the routine isn’t passed the name of a Worksheet, then xlsSheet is set to the current Worksheet:
Dim xlsSheet As Excel.Worksheet

Public Sub setWorkSheet(SheetName As Variant)

  If Not IsMissing(SheetName) Then

    Set xlsSheet = xls.Worksheets(SheetName)

    Call moveToCell("A1", SheetName)

  Else

      Set xlsSheet = xls.ActiveSheet

  End If

End Sub
Because the CellValue method is passed a cell name (for example, “B4”), that method uses Excel’s Range method to set the cell’s value:
xlsSheet.Range(CellRef).Value = txtStr
Because the CellValueRC method is passed a separate row number and column number, the method uses the Cells property to insert the data:
xlsSheet.Cells(RowNum, ColNum).Value = txtStr
In a slight deviation from the topic, I should mention that I used a persisted XML recordset to provide the information for the report. You’ll need ADO version 2.1 to read and write XML files, but as you can see, the ADO Open method is all you need to start reading this powerful data interchange format.
To delete the rows that you don’t need, you must keep a count of the number of rows that you’ve written to Excel from your recordset. When you’re finished, you can delete all the empty rows that remain from the last record down to the totals at the bottom of the worksheet using my DeleteRows method. That method must be passed the number of the row where deleting starts (the row following the last row you added data to) and the number of the last row to be left in the reports (presumably the row before your totals row):
Excel_FX.DeleteRows repRowInt + BegRepRow, _

 MaxRows + BegRepRow — 1
In my class module, I first turn off calculation (otherwise, each deletion would generate a recalculation of the whole workbook). This is the sort of trick that you can easily manage in a class module, but it becomes a little tedious doing it again and again in your main code. Once calculation is turned off, I select the row to delete and delete it (specifying that the following rows should be moved up to replace the deleted row):
xls.Calculation = xlManual

For i = startRow To endRow

  xlsSheet.Rows(startRow).Select

  xls.Selection.Delete Shift:=xlUp

Next

xls.Calculation = xlAutomatic
Copying queries to Excel
Hopefully by now you’ve started to see why a class module can simplify interacting with Excel. However, this is just the simplest part of what the class module will do. For instance, it’s very easy to use the class to display the data from several Access queries in Excel. I’ve used this technique a number of times to make query data available to experienced Excel users where my fee for developing a complete Access report would have been out of the question. In one glorious exercise, I set up the Excel class to transfer 30 queries to a single Excel spreadsheet for some serious end users who needed to process the data in a variety of ways. As part of this particular exercise, I added the TextBookmark method to the class so that users, after opening the Workbook, could navigate to a particular query’s result.
Here’s some sample Access code that selects a position in the Excel spreadsheet, uses my CopyAccessQuery method to transfer a query’s worth of data, and sets a bookmark:
Set Excel_FX = New FXc8_Excel

openOK = Excel_FX.OpenExcel()

If openOK = True Then

   Excel_FX.MoveToCell "C3"

   Excel_FX.CopyAccessQuery "TestAccessCopy", _

    "C3", , "C:E", True

   Excel_FX.TextBookmark "Test Of Adding A Bookmark", "C1"
CopyAccessQuery must be passed the name of the query and the cell to start adding data. Optionally, you can pass the name of the Worksheet to use, a range of columns to be expanded to the width of their widest entry (AutoFit), and True to have the query closed after the data is transferred.
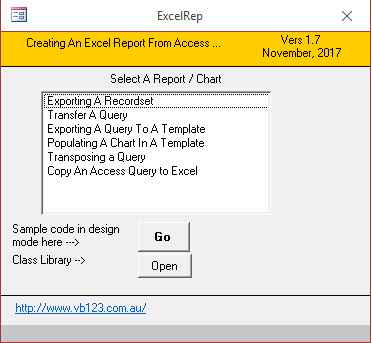
Figure 2 shows the interface for the sample database. The samples that I’ve put together for this article will show you how to use the Excel class library to do all the tasks described in this article and:
- Transfer a group by query into a blank Excel spreadsheet.
- Transfer a group by query into Excel, create a special chart worksheet, and then apply the data to that chart.
- Transfer a query to an existing Excel template and then have it displayed in a chart.
- Transpose a query so that the rows become columns and the columns become rows.
Figure 2
And, since Excel does charting so well, I’ve included additional demonstrations of the Excel charting coding.
In the accompanying download file you’ll find an Access 2000 database, two Excel templates, and an XML file of data. The database uses DAO, a little bit of ADO, and my Excel class.
The real power in this approach is the fact that you can systematically add corporate data into the spreadsheets that end users have toiled over for long periods of time. Set up properly, numerous copies of spreadsheets can be replaced by your software and a spreadsheet template. And it’s very likely that you’ll have substantial end user support for your endeavors because it will probably be their spreadsheet that you’ll use as your template.