Category Archives: Reports and Graphs
Reports: Two Things You Didn’t Know
If you think that reports are boring, Chris Weber and Frank Sutherland are going to show you just how wrong you can be. They also throw in a tip to solve a common problem and show how to improve report … Continue reading
Reports: Multiple Columns and Subreports
Reports can be very frustrating at times. Rich Gorvin offers solutions to two problems that can make reports look untidy: subreports that appear near the end of a page without even the first line of data on the same page, … Continue reading
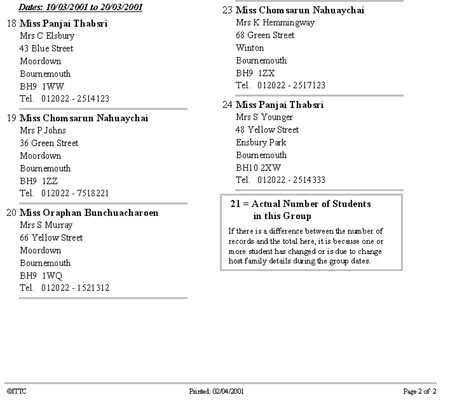
Outputting Flexible Data
Article in pdf format here Producing static reports is easy—but what if your users want to be able to customize their output? Dave Gannon and Nich Mann look at all the options available to you and let you in on … Continue reading
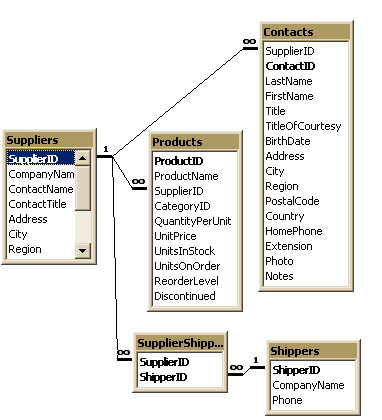
Normalization and Denormalization
Article in pdf format here Helen Feddema approaches the same problem as Garry (Flexible Normalization and Denormalization of Data) , but this time manages her data to provide the users with the output that met their needs. A reader asked … Continue reading
Navigation Through Recursion – part 2
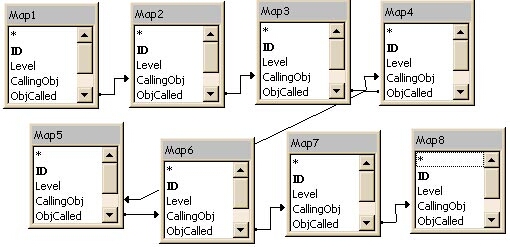
Knowing your way around your Access project is important for any developer. In this article, Christopher Weber demonstrates his recursive query and the reporting techniques he uses to generate a tree navigation map of a database. Along the way, he … Continue reading