If you think that reports are boring, Chris Weber and Frank Sutherland are going to show you just how wrong you can be. They also throw in a tip to solve a common problem and show how to improve report performance.
Information in your database is only valuable if you can get it to your users. And the more effectively that you can present that data, the more valuable the data will be to them. Access reports are one of the most common ways of delivering information, but we’re willing to bet that there are features of the Access reporting system that you’re not taking advantage of. In this article we’ll show two powerful techniques for reports, discuss some performance issues with reports, and (just because we’re nice guys) solve two common problems with reports.
Solution 1: Reports on separate pages
Often users want individual reports that are a subset of a larger report. You could set up each report as a separate report, but this can be time-consuming. A better solution is to create a set of subreports in a main report, and print each subreport on a separate page. This also can be helpful for users who want to be able to compare different parts of a report with each other—if each part is on a separate page, this process is a lot easier.
Unfortunately, the obvious solution of putting page breaks in your subreports won’t stop subreports from sharing a page. Page breaks on subreports seem to have no effect whatsoever. Nor will adding code to the subreport footers to force new pages always work. Neither does setting the Force New Page property of any section when the report is used as a subreport.
The only solution is to control page breaks on the main report. This means putting a page break control between each subreport. However, you want to ensure that you print a new page only when the subreport has actually produced output. Furthermore, you must control the page break effect depending on whether or not the previous subreport displays data. Fortunately, this isn’t nearly as difficult as it sounds and requires only two lines of code.
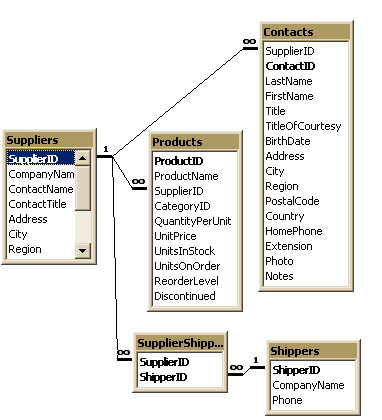
In this month’s Download, we’ve included a sample database with a very simple design. The database has a Supplier table and three child tables, as shown in Figure 1. In this design, Suppliers can have many Contacts, many Shippers, and many Products. We’ve created a pair of main reports (rptSuppliersBlanks, rptSuppliersNoBlanks) each with Supplier information and three subreports (one for each child relationship: rsubContacts, rsubShippers, and rsubProducts). The subreports have their Can Grow and Can Shrink properties set to Yes. We’ve also put page breaks between each subreport to force each to appear on its own page. The page breaks are named after the subreport that they immediately follow (see Figure 2). Lastly, because of the page breaks, we’ve set the Repeat Section property for the Supplier header to Yes so that the Supplier information will appear at the top of each new page.
Figure 1
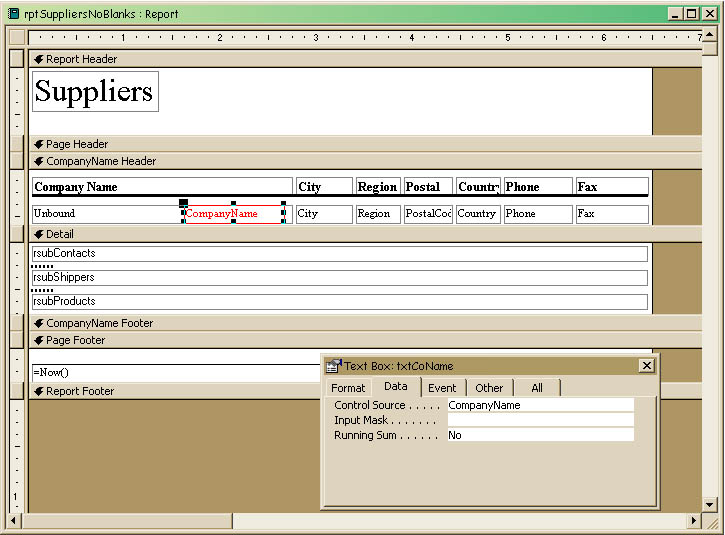
Figure 2
If you run the report (rptSuppliersBlanks), the results are less than satisfactory. Because some Suppliers don’t have corresponding information in one or more of the child tables, we get “blank” pages with just the Supplier header information showing (see Figure 3).
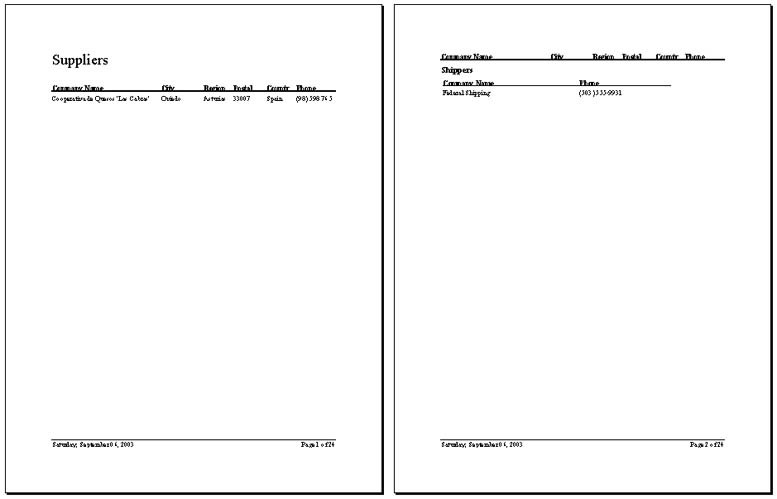
Figure 3
The fix is fairly simple, but it depends on the rarely used HasData property of the Access report object. We use it in a line of code in the Detail section’s Format event to control each page break.
Private Sub Detail_Format(Cancel As Integer, _

FormatCount As Integer)

pgbrkContacts.Visible = subContacts.Report.HasData

pgbrkShippers.Visible = subShippers.Report.HasData

End Sub
In this code we set the Visible property of each page break to True or False depending upon whether or not its corresponding subreport has data to display. The result (rptSuppliersNoBlanks) is exactly what we’re looking for (see Figure 4).

Figure 4
Solution 2: Marking continuing groups
Access reports will display group headers at the start of each group. If the group is spread over many pages, you’ll want to repeat the group header at the top of each page. However, this makes it difficult to determine where a group starts: The same heading appears at the start of the group and on every new page. The best solution is to add the text “con’t…” to the group header after its first appearance.
This is also easy if you can write a bit of code. We’ll build on our previous solution (rptSuppliersNoBlanks) and make the headers for any subsequent Supplier information include the “con’t…” string as specified. We’ve added a hidden control, txtCoName, to the Supplier header (you can go back and see it in Figure 2). We’ve also written an On Print event for the header.
Each time the header is laid out for printing, if the current CompanyName value in txtCoName is the same as strPreviousName we’ll set the unbound control txtCompanyName equal to txtCoName and append the “con’t…” text to it. Otherwise, we’ll just set txtCompanyName equal to txtCoName. Lastly, strPreviousName is assigned the value of the current CompanyName in txtCoName for subsequent comparisons. In this code, it’s critical that the variable strPreviousName be declared static so that the variable retains its value between calls to the GroupHeader Print event:
Private Sub GroupHeader0_Print(Cancel As Integer, PrintCount As Integer)

Static strPreviousName As String

If txtCoName = strPreviousName Then

txtCompanyName = txtCoName & " con't..."

Else

txtCompanyName = txtCoName

End If

strPreviousName = txtCoName

End Sub
Problem 1: Truncated memos
Crosstab reports are the most powerful reports in Access because they allow you to generate your column headings from the data in your database. The data that’s associated with the values in the column headers is automatically slotted into the right column. But things get more difficult when one of the Row Heading fields is a memo field—something that wasn’t even possible before Access 2000 (Access 97 wouldn’t let you use a memo field in a Group By clause, which is essential in crosstabs). Typically everything works fine, except that some of the memos get truncated in the report. Setting the Can Grow property of the memo’s text box to Yes won’t help; the report will keep lopping off chunks of the memo. It looks like the Can Grow property isn’t working. Actually, the control is growing just fine.
We’ve included an Employees and Orders table in both of the databases in this month’s Download. We also created a crosstab query, qxtbTruncatedMemo, which is shown in Figure 5. The query in the Access 97 database version of our database omits the Notes column, which would keep the query from running.
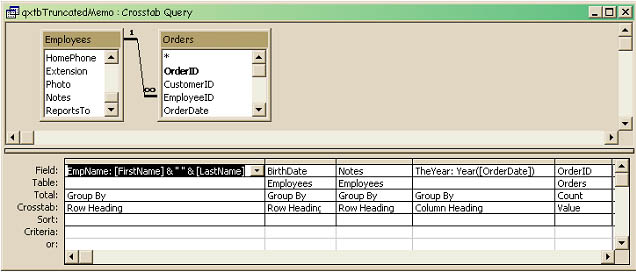 Figure 5
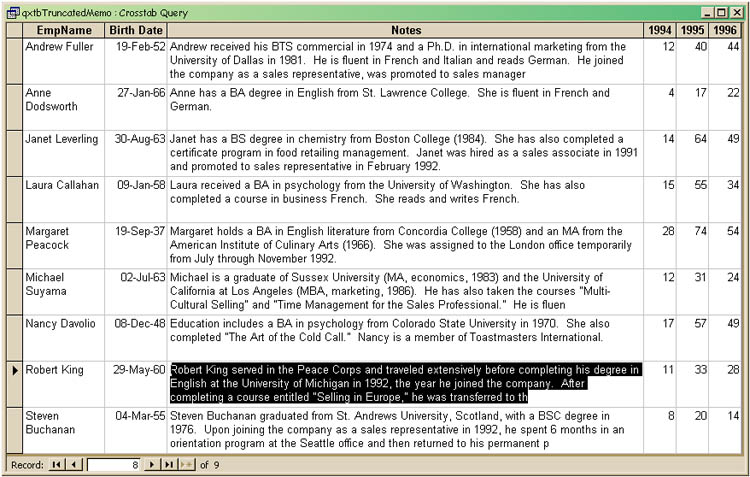
Figure 6
If you run the 2000 version of qxtbTruncatedMemo and expand the row so that the memo field is completely visible (see Figure 6), you can see that the problem isn’t in the report. You can use a memo field in a Group By clause, but only the first 255 characters are used in the grouping.
So, now that you know the cause of the problem, you can fix the report. The trick is not to include the memo in the report’s RecordSource. Instead, retrieve the value independently of the crosstab’s Group By clause. One solution is to insert a subreport that contains the memo and link the subreport to the main report on a unique key field. There is, however, an easier way. We use a DLookup() domain function to retrieve the memo for each row instead.

Figure 7
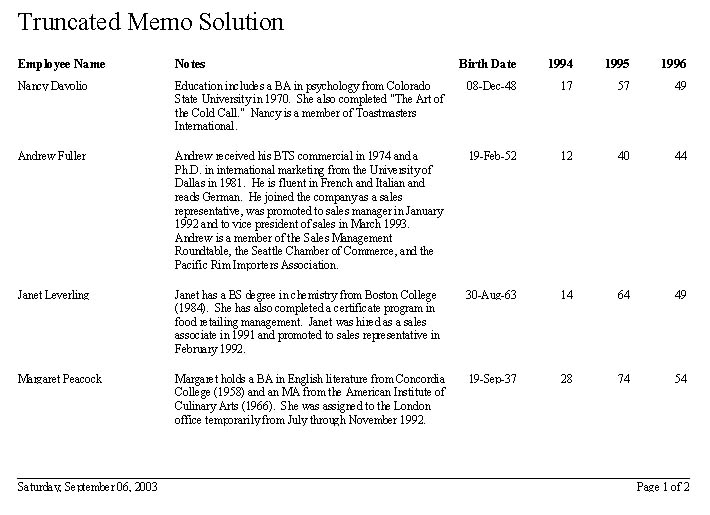
Figure 8
As you can see in Figure 7, txtNotes has its control source set to =DLookUp(“Notes”,”Employees”,”EmployeeID=” & [EmployeeID]). Thus, for each row of the detail section it retrieves the Notes field for the corresponding EmployeeID in the report’s recordsource. Now, we just set the Can Grow property of txtNotes to Yes and all is well (see Figure 8).
Overlapping subreports
Suppose you have a main report with a series of subreports that display related child information. You’re constantly working on the reports as your business evolves. Suddenly a couple of the subreports have begun overprinting each other on the same page. How did this happen?
This is another easy solution: We’ll bet that if you check, you’ll find that there’s a very slight overlap in your subreport controls. Even overlapping subreports by a single pixel can cause the subreports to overprint each other.
The first time we saw this problem, we tried to figure out a useful way to exploit this side effect, but nothing came to mind. We’ve included a set of examples in this month’s database that displays this um… ah… feature. The first is rptNoOverlap, the second is rptPartialOverlap, and the last is rptOverlap. They use the same set of subreports, rsub1, rsub2, and rsub3. The only difference is a very slight overlap in the second report and complete overlap in the third. Open them each in turn and see what happens! Let us know if you find a place to use this. We have a solution, we’re just looking for the problem.
Improving subreport performance
We’ve heard this from a number of our clients. They’ve created numerous form/subform interfaces along with corresponding report/subreports in their Access database. Because of the database’s increasing size, they’ve made the decision to migrate the back-end data to a server. The forms all continue to work without a hitch, but the corresponding reports seem to take forever to open, even though the main report just retrieves a single parent record. This performance problem is especially critical because one of Access’s greatest strengths is the ability to embed child reports (subreports) in a master report. However, when dealing with a server, it’s usually a good idea to alter the way that you use this facility.
First, some background. There have been numerous articles in Smart Access dealing with strategies for limiting the amount of data you retrieve from a server. For example, unless we have very good reason to do otherwise, we always open our server-based forms using the form’s OpenArgs property to pass data that we use to dynamically set the form’s recordsource to retrieve just the single record that we need. We never use the Where condition parameter of the DoCmd.Openform action because it simply filters the entire set to display the chosen record(s) after all the records have been brought down from the server. You can see this for yourself: If you open a form using the Where condition parameter, the form opens with the filter button on the toolbar depressed. Click it, and all your records appear, whether your user should see them or not.
With forms, if your users need to browse the entire set of master records in a main/subform interface, Access handles the processing very efficiently. Access seems to run a separate query for the subform each time you change parent records. So, Access is optimizing performance by retrieving a fresh set of child records each time you change parent records. If you have a quick way of finding the parent record(s) that you’re interested in, the subform itself is very efficient.
Unfortunately, this doesn’t seem to be the case for reports. As far as we can tell, when you link a subreport to the main report through the Master/Child fields properties, Access retrieves all the records in the child table and then filters them down to just the ones for the parent. When working with server data, this can severely hurt the speed of your report.
In many cases, reports are generated based on data in a form. Instead of using the Master/Child fields properties to link your main and subreport, try linking the subreport directly to the limiting data in the form: Have the query in the subreport’s recordsource reference the control on the form that specifies what data to retrieve. For example, if your main report displays an order, use the Order number from the form for the subreport’s query. Here’s a pair of queries that shows what we mean. The first query retrieves data for the main report:
SELECT CusID, OrderID, OrderDate, RequiredDate,

ShipVia, ShipAddress, ShipCity, ShipState,

ShipPostalCode

FROM tblOrder

WHERE OrderID=Forms!frmOrders!txtOrderID

This is the query for the subreport:

SELECT tblOrderDetails.* FROM tblOrderDetails

WHERE OrderID=Forms!frmOrders!txtOrderID
We’ve compared this hard-coded linkage against the usual Master/Child fields properties implementation. With Master/Child fields linkage, our sample report took 40 seconds to display. With the recordsource linkage, it took just one second.
Incidentally, you really shouldn’t use the wildcard asterisk (.*) to include all fields from a server table as we have in our example. Jet doesn’t store knowledge about the server’s field list the same way it does for native Access tables. The wildcard will slow down your data retrieval, as Jet has to first retrieve information that describes the table and then selects the full set of fields. Instead, list just those fields you need in the query’s SELECT statement.
As we said at the beginning of this article, your data is only valuable when you can present it to your users. We’ve given you two new techniques for making your reports more useful, diagnosed two common report problems, and provided a solution for reports in the client/server environment. Go forth and report with power!