Reports can be very frustrating at times. Rich Gorvin offers solutions to two problems that can make reports look untidy: subreports that appear near the end of a page without even the first line of data on the same page, and reports formatted in columns that have the Report Footer on a following page.
If you’ve worked with multiple-column reports, you probably know the feeling. You’ve spent hours getting the criteria to select the right records; you have all of the fields neatly organized on the report; you’ve added the headings, graphics, and borders; you’ve set up the report with two columns and added the final icing on the cake—the calculated field in the Report Footer. Upon previewing the report, you find the report data finishes halfway down the second column of the second page. But where’s the Report Footer with your calculated field? For some reason, it’s at the top of a third page, all by itself. This is annoying, disappointing, and difficult to explain to the client, who probably expects layout issues on an Access report to be as easy to solve as on a Word document.
Here’s another scenario. Suppose you have a fairly complex report that contains a number of subreports. These subreports can expand to display all of their records, so it’s difficult to predict where on the page any subreport will start. When you view the complete report, you find that one or more pages end with a subreport Header at the bottom of a page with not even one row of data beneath it—again, annoying, disappointing, and difficult to explain.
The solution to both of these problems can be found by using Group Headers and Footers in a “non-grouping” way. Instead of breaking my data into separate groups, I use Access’s Grouping feature to put all of my data in one group.
Columns and Footers
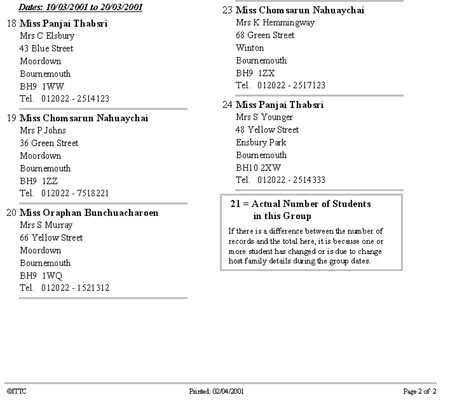
I wanted the final calculated fields in my reports to appear as usual at the end of the report. Page Footers appear at the bottom of each page, but with a calculation that covers all of the data in the report, you usually put the unbound field in the Report Footer. The Report Footer appears at the end of the report, even if that’s partway down the final page—at least until you have a two-column report. On a two-column report, data that takes up 1.75 pages will finish halfway down the second column on page 2. In this case, the Report Footer will appear on a third page, all by itself. Report Footers are the same width as the whole page (that is, not the width of one of the columns) and therefore require the complete width of the page. Since your first column has occupied part of the page, the Report Footer gets bumped to a new page (see Figure 1).
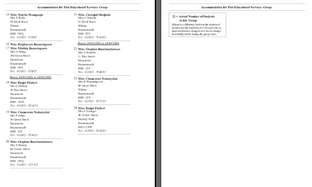
Figure 1
Changing the setup for the columns doesn’t solve this problem, nor does restricting the location of the calculated field in the Report Footer to within the width of one. Fortunately, the solution is quite simple, though it requires a bit of lateral thinking. As there’s no way that a Report Footer can work with two (or more) columns, the solution is to use something else that looks like a Report Footer, acts like a Report Footer… but isn’t a Report Footer.
The answer lies in using a Group Footer, but a Group Footer for a field that has the same value for all of the records. In the example I’ve provided, all of the records displayed are for one of two groups of Thai students. They all share the same value for GroupID, so I set my Sorting and Grouping field to GroupID. Normally a field that has the same value for all records in a report isn’t a sensible choice for grouping, but in this case that’s the point—all of the records will appear in one group with the Group Footer at the end.
To make this work the way that I wanted, I set the Group Heading to No, the Group Footer to Yes, and, within the Group Footer for GroupID, I put the calculated field that I wanted at the end of the report (see Figure 2). Naturally, all of the labels and controls need to be no wider than the column in the detail section.
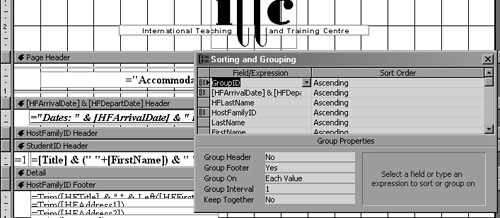
Figure 2
With this “dummy grouping” in place, the other Sorting and Grouping settings can be made as usual, and the rest of the report can be created in the normal manner. When previewed (see Figure 3), the report now has the calculated field at the end of the report, underneath the second column (if that’s the natural end of the report).
Figure 3
Subreports and Headers
This idea of a dummy grouping then gave me an idea for subreports. The same principle could be applied to keep subreport Headers from appearing at the end of a page with no data displayed below. This mildly irritating feature of Access was one I’d grown to accept through gritted teeth. No matter how carefully I set out all of the subreports when designing a complex report, I’d invariably find that one subreport would start near the end of a page, and only the headings/labels from the Report Header would be displayed (see Figure 4).

Figure 4
The advice I got on solving this problem ranged from “Create one enormous query that contains all of the data from all of the underlying queries, and then do normal sorting and grouping” to “Trick Access into putting some data, the first line at least, together with the Header.” The all-encompassing query sounded inefficient to me. It’s more efficient to only have queries extracting the needed data, while the “one enormous query” would have me pulling out rows of repeated information. The tricking option seemed interesting, but I had no idea how to achieve it.
The answer is to use a similar “non-grouping group,” but using a Group Header this time. I changed all of the subreport Headers from the normal type of Header (a Report Header) to a Group Header, again using a value shared by all of the records in the subreport. For a subreport, the obvious choice is whichever field is used as the Link Child Fields setting that links the subreport back to the main report.
My report in this demonstration is a Staff Details Summary, so the logical field to choose for all of the subreports was the StaffID field. For each subreport, I created a Group Header based on StaffID. This time, I set the Header set to Yes and added a Group Footer only when there were calculated fields to be displayed at the end of the report. I then moved any labels or controls that I would have put in the subreport’s Report Header to my newly created Group Header. I then deleted the Report Header. In the Sorting and Grouping properties for the Group Header, I set the Keep Together property to With First Detail. Before closing down the subreport and returning to the main report, I checked and noted the height of both the Group Header and the Detail sections. Now all of my subreports had no Report Headers but had a Group Header (on StaffID) with all of the labels and controls needed. The Group Header was set to keep together with the first line of data.
In the main report, I used the figures I’d noted to set the minimum height for all of the subreports in Design view to the combined height of the Group Header and the Detail (which should give one row of data). Doing this with all of the subreports can make the main report seem lengthier. But if the Detail on the main report is set to Can Shrink, the result is a finished document that might have a little more white space. Extra white space isn’t necessarily a bad thing for readability, and you’re guaranteed that you won’t have detached Headers appearing at the bottom of the page. Either the Header will have at least one line of data, or, if there isn’t sufficient space for this, the whole subreport will start at the top of the next page (see Figure 5).
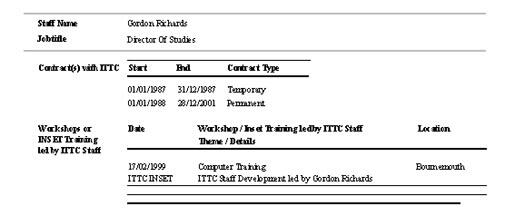
Figure 5
Sorting and Grouping on a field that shares the same value across all of the records is a neat way of tricking Access into doing things that otherwise aren’t possible. Clients often expect documents to appear on paper to the same standard as a word-processed document, not realizing all of the complexities of bringing together a whole range of data from different Tables. By using the techniques I’ve described here, it’s possible to give Access reports a more polished, professional look and to avoid those annoying oddities.