Category Archives: Reports and Graphs
Navigating Through Recursion – part 1
Knowing your way around your Access project is important for any developer. In this first of two installments, Christopher Weber takes us through a navigation map generating algorithm he uses to populate a table that describes how the forms and … Continue reading
How to Pad Access Reports With Blank Rows
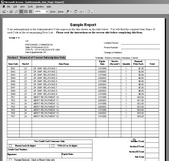
Years ago, I received a client request that stumped me for a couple of days. The application I was working on managed subscriptions to government publications. Under the old system, subscribers were mailed a blank form, a catalog, and instructions … Continue reading
Graph to GIFs and Powerpoint
Although it’s not listed in the IntelliSense dropdown list, MS Graph supports an Export method that lets you save your charts to GIF format. Doug Den Hoed shows you the benefits of exporting your chart and presents an interesting twist—using … Continue reading
Easy as Pie
Chris Weber provides you with a generic method to control the data for pie charts that are actually readable. I got a call from a client last month whose in-house Access programmer had created a multi-page report chock-full of pie … Continue reading
Dynamic Grouping In Reports
Here’s a way to reuse the same report with dynamic Group By levels, which I touched on in my Jan-2001 article “Temporary Tables with No Bloat.” I’ll use a simple sales total example, where sales can be rolled up by … Continue reading