Category Archives: Reports and Graphs
Dot Leaders and Table Of Contents Reports

This month, Ken takes on just two topics, both centered on reports: creating dot leaders for two-column reports and creating a table of contents (or index) for a report. Both topics work equally well in Access 2 and in Access … Continue reading
Creating a Great Report
In this installment of his ongoing series, Dave looks at the part that reports play in developing your application. In addition to discussing the issues around development, this article looks at the most effective way to build your reports and … Continue reading
Create Dynamic Chart Applications
The Chart object that ships with Microsoft Office can be daunting to use, but it also lets you create very flexible displays. In this article, Garry Robinson shows you not only how to use this powerful tool but also a … Continue reading
Complex Report Selection
Many of my clients request a lot of flexibility in the criteria they can use to print a report. I give them a selection screen with combo boxes to allow them to choose the criteria that will control the data … Continue reading
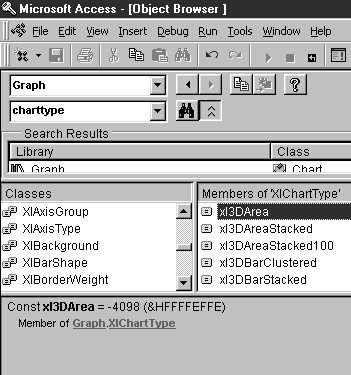
Analyze Your Data in Space
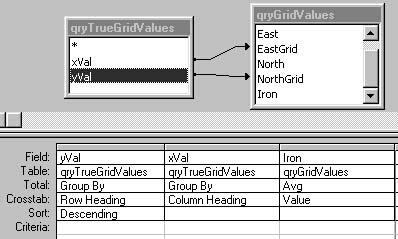
Microsoft Access isn’t known as a tool for displaying spatial or mapping information. But, with a few special tricks, some crosstab queries, and MSGraph, you can transform coordinates into useful maps. Garry Robinson demonstrates techniques that can be used for … Continue reading