The Chart object that ships with Microsoft Office can be daunting to use, but it also lets you create very flexible displays. In this article, Garry Robinson shows you not only how to use this powerful tool but also a way to generate the code to use it.
For a long time, my approach to creating graphs in Access was to set them up at design time with the look and feel that I wanted and then, at runtime, limit my changes to manipulating the query whose data the graph displayed. When Access 97 became the standard version of Access used by most of my clients, I decided it was time to learn how to manipulate the complicated Chart object itself. This article will show you the techniques that you can use to program the Chart object using both the object’s properties and SQL. The goal is to provide the user with a display that lets them:
- Control the appearance of the graph
- Change the type of graph being displayed
- View or hide the graph’s underlying data
- Sort the data into different orders
- Restrict the data displayed to the top items
Microsoft Access ships with many smart components. I think that the most complicated of these standard objects is Microsoft Chart and, as a result, it’s also one of the most useful. Not everything about it is hard, though. Since MS Chart is part of Access’s standard install process, you’ll find the object on most computers with Access, making it easy to add to your applications. Adding a graph to a form is also easy: Select Insert | Chart from the menu, then draw the Chart on the form. The form wizard will guide you through the process of setting up the graph and associating it with a table or query to display its information.
The Chart object is complicated because it has so many features and because they’re interrelated. Generally, setting one property requires you to change some other property in order to make the object work the way that you want. Access’s wizards also make the graph object appear to be a fully integrated component like a text box, but the Chart object really needs to be managed with code in the same way that you might manipulate Excel from Access. In fact, as I’ll demonstrate, you can use Excel to help you work with the Graph control.
The demonstration database
I’ve provided a demonstration database called Smartgraph.MDB in the accompanying Download file. In that database, there’s a table called zWorld_Demo and a form called z_GraphPlus. The form has the Chart object embedded in it and contains the Visual Basic code that I use in this article to manipulate the object (see Figure 1). If you find the form useful, you could import it into your application and change the row source to suit your data. The code under the form will work for any data. Table 1 shows the format of the table whose data I’m graphing and some of the sample data.
Table 1. Sample rows from the zWorld_Demo table.
| Product name | Region | Country | SalesDate | Sales | Budgets |
| Bottled Water | The Americas | Mexico | 28-Oct-98 | 780.00 | 760.00 |
| Bottled Water | The Americas | USA | 28-Oct-98 | 420.00 | 400.00 |
| Cola | Asia/Pacific | Australia | 14-Jan-98 | 343.00 | 600.00 |
| Cola | Asia/Pacific | Japan | 14-Jan-98 | 4000.00 | 3600.00 |
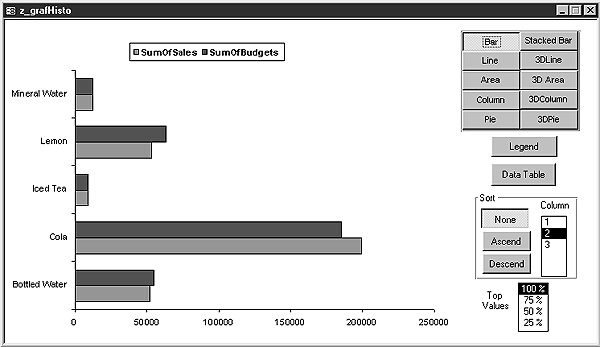
Figure 1
The sample form presents a very flexible interactive application for displaying data graphically. The form includes the following:
- the Chart object, embedded on the left-hand side
- a set of toggle buttons in an option group that change the graph type
- a toggle button to turn the display of the graph’s legend on and off
- a toggle button to turn the display of the graph’s data table on and off
- a list box to let the user limit the graphed data to the top percentage of the data
- a list box to sort by any field in the underlying query in ascending or descending order
Manipulating the graph
To change the graph type from a bar graph to a pie graph, based on the user’s choice, I use the following code behind the form:
Private Sub GrafType_AfterUpdate()

[GraphFX].Object.Application.Chart.ChartType  = GraphType

End Sub
In this code, GraphType is the name of the option box on the form. [GraphFX] is the name of the Chart control. What I’ve done in the form’s design is set each of the option box’s choices to a number that matches one of the constants used by the Chart object’s ChartType property. In the form, the “Bar Graph” option box has its OptionValue property set to 57, the value of xlBarClustered constant. When the user selects the Bar Graph toggle and I set the GraphType property to the value of the option box, it’s equivalent to setting the GraphType property to xlBarClustered.
The complete list of constants for Access 95, 97, and 2 are shown in Table 2. As you can see from the table, there are differences between the graph objects that come with the different versions of Access. For a more complete discussion, see the sidebar, “Microsoft Chart and Graph Versions.”
Table 2. The constants used in MS Chart to change the graph type.
| ChartType | 97 constant | 97 value | 95/2 equiv. | 95/2 value |
| Bar | xlBarClustered | 57 | XlBar | 2 |
| Stacked Bar | xlBarStacked | 58 | N/A | N/A |
| Line | xlLine | 4 | xlLine | 4 |
| 3D Line | xl3Dline | -4101 | xl3DLine | -4101 |
| Area | xlAreaStacked | 76 | xlArea | 1 |
| 3D Area | xl3DareaStacked | 78 | xl3DArea | -4098 |
| Column | xColumnClustered | 51 | xlColumn | 3 |
| 3D Column | xl3Dcolumn | -4100 | xl3DColumn | -4100 |
| Pie | xlPie | 5 | xlPie | 5 |
| 3D Pie | xl3DPie | -4102 | xl3DPie | -4102 |
Generally speaking, it’s bad practice to store constants as hard-coded numbers in your application. In this case, the resulting code is so simple that I feel it offsets the problems raised by embedding the constants in the ToggleButtons.
Adding a legend to the graph demonstrates the problems in working with the Chart object. You’d imagine that you could simply turn the legend on and off. Well, yes, you can. But turning the legend on causes the width of the actual graph to be reduced to provide room to display the legend. This doesn’t matter if the form that you’re using completely fills the screen, but when the form occupies a smaller amount of space, the reduced graph might be too small to read. After a lot of experimentation, my preferred design is to use the legend as a pseudo-title line and display it at the top of the screen. This means I don’t have to deal with allocating space for a separate title, and it saves some valuable real estate for the graph to display itself. Here’s the code to display the legend at the top of the graph:
Private Sub legendTgl_Click()


With [GraphFX].Object.Application.Chart

If legendTgl = 0 Then

.HasLegend = False

.PlotArea.Width = .Width

.PlotArea.Height = .Height

Else

.HasLegend = True

.Legend.Position = -4160


.PlotArea.Width = .Width

.PlotArea.Height = .Height

End If

End With


End Sub
This example demonstrates that if you alter a property of the graph is some way, it’s fairly likely that other parts of the graph are going to be affected. When this is an issue, you’re going to have to work out a way to fix those other properties with some compensating property changes. This is one of the reasons that manipulating the Chart object can be time-consuming.
The other lesson in this code is to use the With statement whenever you can when programming with the Chart object. The With statement not only makes for cleaner looking code, it also improves performance because the With statement creates a single reference to the object rather than a reference for each line of code.
One of the features of the latest version of the object is that it allows you to view the actual data that makes up the graph using the HasDataTable property. Here’s the code that displays the data table by setting HasDataTable to the predefined constant dataTableTgl:
Private Sub dataTableTgl_Click()

With Me![GraphFX].Object.Application.Chart
.HasDataTable = dataTableTgl

End With

End Sub
Integrating the Chart object
I found that I could learn most of what I needed to know about working with the Chart object by using IntelliSense to list the Chart object’s methods and properties. This might not work for you if you haven’t been involved with graphs before, but it sure beats hunting around the very poor documentation and examples that come with the object. Figure 2 shows the IntelliSense support for the Chart object.
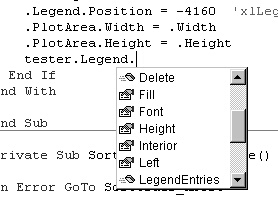
Figure 2
To get the IntelliSense support, I’ve used a couple of tricks that need explaining. To begin with, I had to select the Microsoft Graph 8 object library in my project’s References list. The code that I’ve used so far doesn’t require this library to be referenced. This is deliberate because the Chart object isn’t a standard reference when Access is set up on a new machine. If you’re going to do a lot of Chart manipulation, I’d keep this reference selected.
Once you’ve added the reference to the Graph 8 Object Library, you can add the following declaration to your module:
Dim Tester as Chart
This Tester object variable is of the right type to display the IntelliSense for a Chart object. You can’t actually use the Tester object variable since, while it could refer to a Graph object, it doesn’t. I could use this statement to get Tester to refer to the object on the form:
Set Tester = [GraphFX].Object.Application.Chart
Since I already had the [GraphFX] reference to work with my Graph object, I didn’t bother setting Tester to point to the Chart also.
With the Tester variable declared, however, I could use Tester with IntelliSense to display the methods and properties of the Chart object. Selecting the method or property that I wanted from the IntelliSense list helped me generate the code that I needed. I’d then cut and paste the code from the Tester variable onto my [GraphFX] reference.
For instance, using the Legend Position Property with the Tester object variable, I get this code:
tester.HasLegend = True
I then copied it over to the object on the form to give this code:
With [GraphFX].Object.Application.Chart

.HasLegend = True

End with
By using the full reference to the Chart object with ControlName.Object.Application.Chart, I can delete the library reference to the Graph 8 object library after I’m done creating my code.
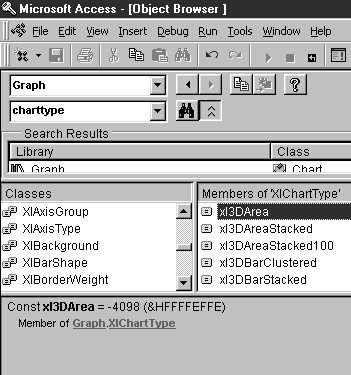
The second tool that I used to explore the Graph object was the Object Browser. I used the browser to find the actual values of the constants associated with the object. Using the Object Browser also requires that you set a reference to the Graph 8 Object Library. You can open the Object Browser from any code module by pressing the F2 key (or from the menu by selecting View | Object Browser). With the Object Browser up and running, you can select the Graph Library from the Libraries list and view the Constants that appear after all of the Graph classes (see Figure 3).
Figure 3
When I’ve finished using IntelliSense and the Object Browser, I turn the reference to the Graph 8 Object library off and recompile/test the code.
Access 95, Access 2, Excel, and Graph
The Chart object can be used with other versions of Access, though there are differences. For Access 95, you’ll need to reference the Graph 5 library. The settings inside the Chart object are different for the two libraries. If you’re programming for Graph 5, you’re not going to get IntelliSense to help you out, making life that little bit harder. Instead, you can take advantage of the fact that the Chart object is closely related to charting in Excel. This lets you try my “Excel cheating methods” to find out some of the object’s more difficult settings.
Included in the accompanying Download file is an Excel 97 file called smartGraf.xls. You can use this spreadsheet to work through the following steps to get Excel to generate the Visual Basic code to manipulate the Chart object. Here’s the process:
1. Enter some data into the spreadsheet.
2. Make up a graph inside Excel, using the Chart Wizard.
3. Start recording a new Excel macro by selecting Tools | Macro | Record New Macro.
4. Make the changes to the graph that you want to make in Access. You do this by right-clicking on the part of the graph that you want to alter and selecting an option from the popup menu.
5. Stop recording the macro.
6. Return to Tools | Macro and open the macro you just created. This will display the Visual Basic code generated by your change to the graph.
Here’s the VBA code generated by the macro recorder when I modified the Y axis settings of a graph in Excel. Running this code will replay the change that I made:
ActiveChart.Axes(xlValue).Select

With ActiveChart.Axes(xlValue)

.MinimumScaleIsAuto = True

.MaximumScale = 200000

.MinorUnitIsAuto = True

.MajorUnitIsAuto = True

.Crosses = xlAutomatic

.ReversePlotOrder = False

.ScaleType = xlLinear

End With
As I did with the Tester object, this code can now be copied to Access and attached to the GraphFX object. The resulting the code looks like this:
With _

Me![GraphFX].Object.Application.Chart.Axes(xlValue)

.MinimumScaleIsAuto = True

.MaximumScale = 200000

.MinorUnitIsAuto = True

.MajorUnitIsAuto = True

.Crosses = xlAutomatic

.ReversePlotOrder = False

.ScaleType = xlLinear

End With
My Excel cheating methods let you generate the Visual Basic code to do many things with your Access graphs without anywhere near the steep learning curve. This method won’t always return the correct code, but it sure will give you a good start on the properties that you should be manipulating.
Using queries to manipulate Graph
All of the preceding techniques for controlling Microsoft Graph will add some pizzazz to your displays, but the real art of making graphs work is in setting up the correct queries to feed your graph. You manipulate the queries through the Graph object’s RowSource property.
In many cases, you’re going to use summary queries in conjunction with a graph (see my article, “Consolidating Your Data With Queries,” in the October 1998 issue of Smart Access). If you create a summary query on the sample table to show the top 25 percent of sales results by product, you’d have the following SQL query driving the graph:
| SELECT | |
| [Top 25 Percent] | Optional Top Values Clause |
| productName, | Group By Columns |
| Sum(sales) AS totSales | Aggregated values |
| FROM TblSalesResults | Table/Query source |
| WHERE ((state=”NSW”) | Where Clause |
| GROUP BY productName, region; | Group By Columns |
| ORDER BY Sum(sales); | Order By Clause |
The Sort Options box on the form allows the user to resort the data. In the form, before displaying the Sort Options box, I first test to see whether the row source is a summary query. I do this in the form’s Open event by retrieving the SQL string from the Chart’s RowSource property and checking to see whether it contains the string “Group By.” In the following initialization code, I also find the number of fields in the query to support the form’s sorting options:
 Test if sorting is appropriate

sqlStr = Me![GraphFX].RowSource

If InStr(sqlStr, "Group By") > 0 Then

Me![SortOrder].Visible = True

' Now find the number of fields in the sql

icount = 1

sortVals = icount & ";"

iLast = 1

iFrom = InStr(sqlStr, "from ")

While InStr(iLast, sqlStr, ",") > 0 And _

icount < 20

icount = icount + 1

sortVals = sortVals & icount & ";"

iLast = InStr(iLast, sqlStr, ",") + 1

Wend

Me![SortColumn].RowSource = sortVals

Else

Me![SortOrder].Visible = False

End If
After this code finishes executing, the Sort Options box on the form will be displayed if the row source is suitable. When the user selects one of the sort options, I remove any existing sort clauses in the SQL string. Since the Order By clause is always at the end of the SQL string, this can be done using standard string handling functions. I then add a new sort order based on the selection on the form. Rather than order by a field name, I reference the column to sort on using its numerical position in the query. If the user selects the second field in the query, this translates into a SQL statement containing the clause Order By 2:
If istart > 0 Then

' The Order By clause is always at the end of

' a consolidation query, so first I remove it.

sqlStr = Left(sqlStr, istart - 1)

End If


' Now add the appropriate sort.


Select Case SortOrder

Case 2

sqlStr = sqlStr & " order by " & _

Me![SortColumn] & " Asc;"

Case 3

sqlStr = sqlStr & " order by " & _

Me![SortColumn] & " Desc;"

End Select


' Update the rowsource with the new query.


Me![GraphFX].RowSource = sqlStr
One of the useful extensions that the Jet Engine provides to SQL is the Top Values clause. You can use this in the SQL window and also as a property of the query in the Query Design window. The following code shows a portion of the routine that adds the Top Values clause to the SQL taken from the Chart’s RowSource property. In this routine, the istart variable marks the first character in the SQL string after the Top Values clause:
Select Case TopValues

Case " 75 %"

sqlStr = "Select Top 75 percent " & _

Mid(sqlStr, istart)

Case " 50 %"

sqlStr = "Select Top 50 percent " & _

Mid(sqlStr, istart)

Case " 25 %"

sqlStr = "Select Top 25 percent " & _

Mid(sqlStr, istart)

End Select


' Update the rowsource with the new query.


Me![GraphFX].RowSource = sqlStr
References
There are two invaluable Microsoft downloads that you should use if you want to work with the Graph library. The most important one is the Microsoft Graph examples database, which was the catalyst for many of the ideas in this article. You should also download the Microsoft Knowledge Base Help file and look for article “Q154582: How to Use Automation to Change a Graph Chart Type” (I explain how to get it at http://www.gr-fx.com/tips/99/freestuff.htm). You can find a diagram of the full Graph 5 object model at http://premium.microsoft.com/msdn/library/techart/msdn_msgraph5.htm.
In this article, I’ve given you enough information to start creating interesting applications with Microsoft Graph. As always, when you start to program with multiple tools, bear in mind that the costs of programming and support will be higher than simply staying within the Access envelope. Also, remember that there are third-party graph controls around that might just do the job better and easier than MS Graph. Graph, however, provides you with a tool for creating Access applications that comes with the most popular software package in the world — Microsoft Office.
Sidebar: Microsoft Chart and Graph Versions
A couple of months ago, I became involved in a project for a company that sells a popular management analysis program written in Visual Basic 5. The aim of the project was to replace a third-party graph control with the Chart control that comes with Visual Basic. Even though I’ve been involved in graphing-related activities over a long period of time, I’d never taken a look under the hood of the Microsoft Chart control. I simply assumed that it would be very similar to the Graph objects that come with Office 97. This turned out not to be the case, which made replacing the third-party control that much tougher for me.
The Graph objects that Microsoft ships and the products that they ship with are shown in Table 1a . The first difference between these objects is the way that you interact with them. For all of the versions that ship with Access, the object is smart enough to allow you to pass it a SQL string to use as a datasource. This is the most flexible programming method, as it will handle any amount of data. Access runs the SQL statement and turns the query results into a spreadsheet grid before passing the data to the chart control.
Table 1a. The Graph objects and the products they ship with.
| Object | Product |
| MS Graph / Chart 8 | Access 97 and Excel 97 |
| MS Graph / Chart 5 | Access 95 and Access 2 and Excel 95 |
| MS Chart Control | VB 6 |
| MS Chart Control | VB 5 |
The Chart control in Visual Basic 6 will allow you to assign an ADO data control as a datasource for the object. With the Graph object that comes with Excel, you must insert the data into some cells in the spreadsheet before graphing it. The Visual Basic 5 Chart control requires that you load a two-dimensional array to populate the control.
The most significant changes between the current and previous generation of tools is in Visual Basic. The Chart control in VB 5 had a very primitive look. Among other things, the histograms lacked borders and some of the 3D displays were unusable. The different chart styles that were supported were limited even compared to the version of MS Graph that came with Access 2. VB 6 brought a number of changes, including the ability to work with ADO datasources.
The final difference between the various versions is the time that it takes to set up the graph at design time. Excel definitely wins out in this area. With Access, you not only have to battle with a tougher customization environment, but you also have to ensure that you’re starting off with good data before you begin to manipulate the chart. The Visual Basic Chart control has fewer properties to manipulate than the Graph object and is generally a less effective tool than Graph/Chart 8.
So now that the graphing project is coming to an end, what did I do? I wrote a custom graphing ActiveX control. This wasn’t my plan, but the final control did everything the customer wanted, was far simpler to implement into their product, and was only about 100K in size.
Other Pages You Might Want To Read
Programming Pivot Tables for Access Forms
Top Values, Hierarchical Lists, and Almost Equivalent Strings