Russell Sinclair shows how to summarize data using PivotTables.
ONE of the great new features of Access 2002 and beyond is actually one that’s been included in Excel for some time—the ability to create dynamic information summaries in tables and charts. These summaries are called PivotTables and PivotCharts, and they’re designed to allow a user to quickly create a summarized view of the data on which a form or datasheet is based. PivotTables and PivotCharts are part of the Office Web Components included with Office XP and Office 2000, and are actually based on ActiveX controls in this library. This means that these items can be used in forms, datasheets, and on Web pages. However, it’s with Access 2002 that they’ve been integrated with Access forms and datasheets so that you can use these objects without having to insert a control. Instead, they’re defined as views that you can enable or disable as you see fit.
PivotTables and PivotCharts are a new concept to many developers. Even those people who have been using PivotTables in Excel for some time will be amazed at some of the functionality that’s been added in the latest version of Microsoft Office. This month, I will concentrate on the creation and use of the PivotTable object.
Anatomy of a PivotTable
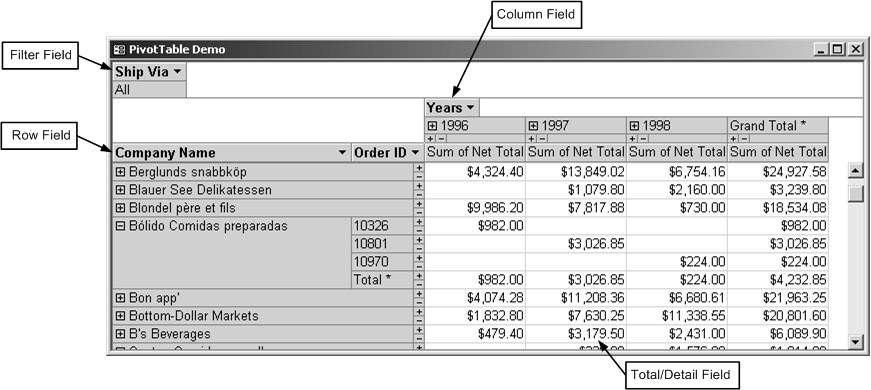
PivotTables allow you to summarize data in columns and rows, in much the same way that you can summarize data in crosstab queries. PivotTables, however, are much more powerful than crosstabs. PivotTables can be used in any datasheet view of a table or query, or as a view of the data in a form. Figure 1 shows a form in PivotTable view, and the parts that make up the object itself.
Figure 1
The first and most important element of a PivotTable is the Total/Detail section. This area contains the summarized data and/or the individual data elements that make up the summary information. The Total/Detail section corresponds to the Value fields in a crosstab query and is shown as the main data in the grid. The data in this section can be viewed in one of two modes: as detail records or as totals. When viewed as detail records, each item in the source data is shown in its own cell. In this mode, data isn’t summarized in any way. When viewed as totals, data is summarized according to the settings or calculations that you’ve defined for your data. Totals view is the default view for a PivotTable, and is where the real power lies in this new feature.
In order to make the detail section of your PivotTable contain any useful information, you’ll normally want to summarize the data by some value, rather than just having a single total. In order to do this, you need to add either a Row field or a Column field, or both. Row fields are shown on the left side of the PivotTable, and allow you to add successive groupings by which your data is summarized. This area is the best area to use for groupings that are based on data that has a high number of unique values. A row is created in the table for each unique value in the Row field, showing a subtotal or detail data for that item.
Column fields work in much the same way as a Row fields except that individual values are shown across the top of the table, forming columns by which the data is further summarized. Each unique value in the Column field forms its own column in the table. This area is best used to summarize data that has a low number of unique values, as large numbers of columns can clutter up a PivotTable and make the information difficult to read.
Both the Row and Column field areas can contain more than one field by which the data is summarized. Multiple fields in each of these areas are shown as different field names in each title bar, listed in order of categorization level from left to right. Fields shown closer to the data are referred to as Inner fields, as they’re closer to the data, and fields further from the data are called Outer fields.
The final data element of a PivotTable is the Filter field or fields. These items, appearing above the table itself, allow you to filter the data in the PivotTable by a field that isn’t included as a Row or Column field. Now that you’re familiar with the terms used in working with PivotTables, you’re ready to learn how to create and use them.
Creating PivotTables
The first step in using PivotTables is to open a table, query, or form in PivotTable view. This view can be accessed from the View toolbar item when the object is opened. The first time an object is opened in PivotTable view, you’ll be presented with a blank PivotTable showing the different drop areas that you can use to create your table (Figure 2). Along with the blank table itself, you should see the PivotTable Field List dialog, shown in Figure 3. If this dialog isn’t visible, right-click anywhere on the table and select the Field List menu item from the context menu.
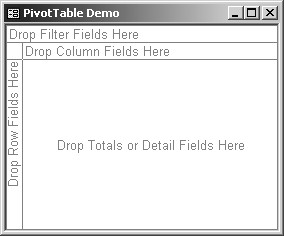
Figure 2. Blank PivotTable.
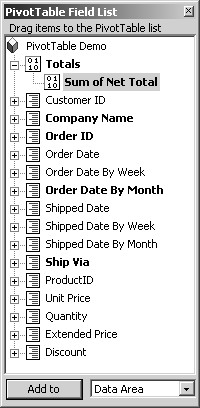
Figure 3. PivotTable Field List.
The field list shows the available fields for your PivotTable. Fields shown in bold are those fields that are already in use in the table. Only those fields available in the output of a query or table, or those fields in use on a form will appear in this list. Note that PivotTables built on forms will only be able to access those fields that are bound to controls, and only for those controls that have their Visible property set to Yes. Also, hidden columns in query or table datasheets won’t be available for use in the PivotTable. If you want fields not listed in this dialog to be available, you’ll need to add them to the source of your data, create controls for them on your form, or unhide them from your source object.
To add a field to your table, select and drag the field from the field list to the appropriate drop area on the table, or select the field and then use the Add To button with the drop area selected in the drop-down to the right of the button. The field will then appear in the selected section, ready for use in your PivotTable.
Data summarization
When you add a field to the Total/Detail area in the table, the data may automatically be summarized by the PivotTable. By default, numeric fields are summarized using the Sum function, and non-numeric data is summarized using the Count function. Each total that’s been created in your PivotTable will show up in the field list under the Totals item.
To change the summarization function for a field, select the field in the table and choose AutoCalc from the PivotTable menu to view a submenu that shows the standard summarization functions that you can use for your field. If none of these functions is appropriate for your data, you can create your own calculated total or detail fields for use in the table.
Custom calculations can be created for detail data or for totals. However, calculations can only use standard VBA functions (you can’t call your own functions) and, if based on data, must be built from existing data at the same level. In other words, detail calculations can’t use data that’s not listed as detail fields, and total calculations can’t use existing data that’s not listed as total fields. You can’t create custom-calculated totals that reference detail fields (only AutoCalc can summarize detail records), and you can’t create custom-calculated detail fields that reference total fields.
In order to create your own custom-calculated field or total, from the PivotTable menu choose Calculated Totals and Fields and select the appropriate submenu item. You will be presented with the Properties dialog shown in Figure 4.
The Name section allows you to give your field or total a meaningful name by which you can refer to this item in other calculations. I suggest that you use the same naming conventions that you use for fields in your tables. This makes it easier to determine what fields you’re using if you reference this calculated field in another calculation later on.
The large area on the bottom of this tab allows you to define the calculation that will be used for your field. Use standard VBA syntax to create your calculation. If you want to base this calculation on an existing field or total, you can manually type the field name or select it from the drop-down below the edit area and click the Insert Reference To button. Using the button is the preferred method, as it means that the potential for typographical errors or errors in field references is reduced. The dialog won’t warn you if there’s an error in your entry, but the error will show up on the PivotTable itself. Click the Change button at the bottom of this dialog to save your changes. You can then close the dialog and return to designing your PivotTable.
When you use your own calculations in PivotTables, keep in mind that it’s often faster to have your query calculate these values for you. In some cases, this isn’t practical. However, PivotTables must recalculate custom fields each time the view is changed. If you create the calculation in your query, it’s only executed the first time the object is opened.
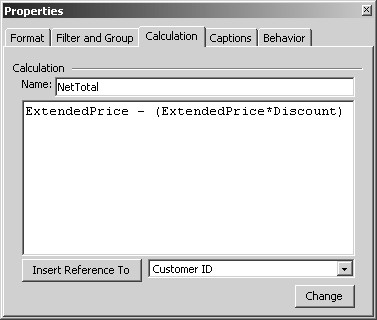
Figure 4. Custom calculation.
Using PivotTables
PivotTables are extremely flexible, and you can change them with little effort. You can rearrange fields on the table simply by dragging them around to change their order in each drop area, move them from one area to another, or even remove them from the table altogether.
All fields used as Row, Column, or Filter fields allow you to filter data based on values within a field. Beside each field caption in these sections, you’ll notice a dropdown arrow. Clicking on this arrow will display the Filter drop-down, like the one shown in Figure 5.
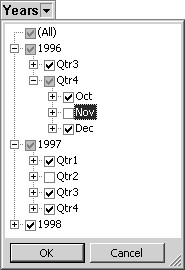
Figure 5. Field drop-down.
This drop-down presents a list or tree of the available filters for this field. You can exclude or include a set of values by changing the check box beside each item. By default, you can select multiple items in the list by checking the appropriate items. If you want to show only one item from the list at a time, select the field in the Filter area for which you want to change the behavior. From the PivotTable menu, select the Properties menu item and on the Filter and Group tab, turn off the option “Allow selecting multiple items when in filter area.” Note that you can’t modify this behavior for fields listed in the Row or Column areas—fields in these areas always support multiple selections.
Within each summary level of your PivotTable, you can show or hide lower summaries in inner fields. Each summary level can be accessed or hidden by clicking the + (expand) or – (contract) sign to the left of each row or column entry. You can also show or hide the detail records that make up the total for each entry by clicking the expand or contract commands to the right of each row or below each column. Detail records can also be accessed by right-clicking on a field or cell for which you want to view detail data and selecting the Show Details or Hide Details item from the context menu.
Occasionally when you’re using PivotTables, the data that you see might not be up to date with entries that other users have made. If you want to refresh a PivotTable so that it contains the most current data, click the Refresh (!) button on the toolbar, and the table will be recalculated. If you want to cancel a long-running refresh, simply press the Esc key to cancel the update.
You should also note that settings for PivotTables are shared between multiple users and are “sticky” between uses of a field. This has two important repercussions. The first is that if you share your database with other users, your PivotTable might change each time you access it. This could mean that your PivotTable isn’t summarizing the data the way that you think it should be. The other repercussion is that if you or another user has summarized or formatted a field in PivotTable view in the past, the formatting and summarization that will take place will mirror previous settings. Although this can be very useful in distributed databases, where each user has their own copy of a database, it has the potential to mislead you if you don’t pay close attention to the settings used when a field is added to the table.
Taking the next step
PivotTables are extremely flexible and, used wisely, can become an extremely powerful data analysis tool. Not only do they allow you to summarize Access data in this way, they can also be used in ADP files to summarize SQL Server data. This means that the lack of support for crosstab queries in SQL Server is no longer a problem for Access developers.
PivotTables support a large number of features that simply can’t all be explored in one sitting. The Properties dialog discussed briefly earlier is context-sensitive and can apply to cells, fields, totals, grand totals, and even the PivotTable itself. I suggest that you take some time to create some PivotTables for yourself and play around with the properties of each item to see what can be accomplished.
Next month, I’ll take a look at PivotCharts, and how they can save you from going “report-happy” in Access databases.
See Also
Create Dynamic Chart Applications